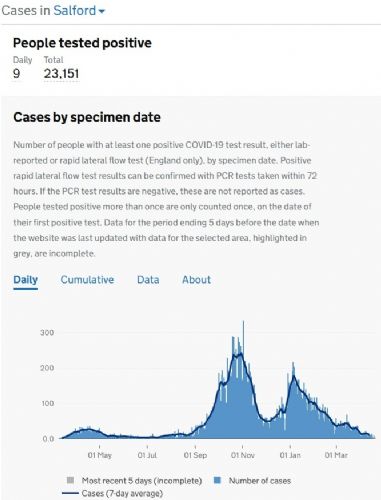
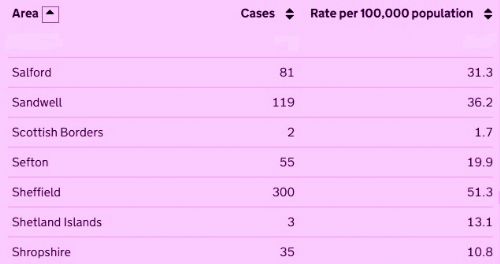
Salford has 9 new coronavirus cases, down from the previous day's 10, bringing the cumulative total of cases to 23,151. The seven day average of cases in Salford is now 81, up from 80, while the seven day rate per 100,000 population now stands at 31.3, up from 30.9.
Elsewhere in Greater Manchester, the seven day average of cases in Bury is 51 (down from 52), with a seven day rate per 100,000 population of 26.7 (down from 27.2); Bolton 141 (up from 137), with a rate of 49 (up from 47.6); Manchester 260 (down from 275), with a rate of 47 (down from 49.7); and Oldham 138 (down from 150), with a rate of 58.2 (down from 63.3).
Rochdale has a seven day average of cases of 95 (down from 102), with a seven day rate of 42.7 (down from 45.9); Stockport 73 (down from 79), with a rate of 24.9 (down from 26.9); Tameside 80 (up from 77), with a rate of 35.3 (up from 34); Trafford 71 (down from 73), with a rate of 29.9 (down from 30.8); and Wigan 118 (down from 124), with a rate of 35.9 (down from 37.7).
There have been no new virus-related deaths announced by Salford Royal Hospital for the eleventh day in a row.
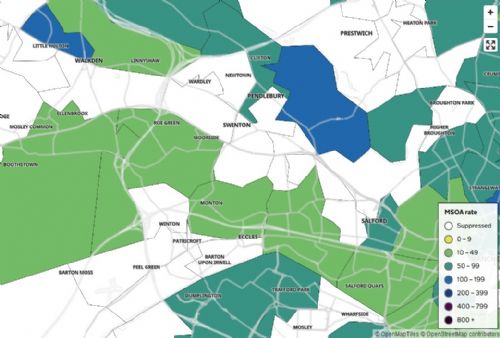
Meanwhile, the latest interactive map of virus cases for Salford which shows seven day rolling rate data for the week ending 16th April, reveals that most areas of the city now have less than three cases (coloured white on the map).
The highest number of cases were in Clifton Green and Pendlebury East, with 8 cases and a rolling rate of 103, Higher Broughton with 8 cases and a rolling rate of 51.0, and Walkden North West with 7 cases and a rolling rate of 113.7.
Other areas with cases over 3 are:
Clifton – 4 cases with a rolling rate of 67.5
Pendleton – 4 cases, rolling rate 61.1
Kersal Dale – 4 cases, rolling rate 55.7
Eccles – 5 cases, rolling rate 43.6
Weaste and Seedley – 4 cases, rolling rate 30.2
Lower Irlam and Cadishead – 4 cases, rolling rate 38.3
Ordsall and Salford Quays – 4 cases, rolling rate 25.8
To view the map click here and enter a postcode




.jpg)


.jpg)
.jpg)
(3).jpeg)
.png)
(1).JPG)
