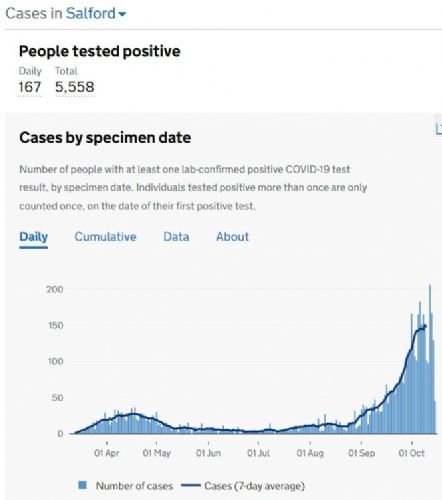
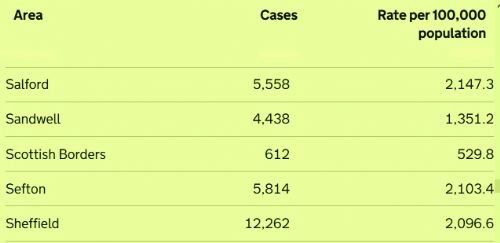
Salford has 167 new coronavirus cases, bringing the cumulative total to 5,558, up from the previous day's 5,391.
Elsewhere in Greater Manchester, cases in Manchester rose to 14,678 (up from 14,338), followed by Bolton 7,171 (up from 6,993), Oldham with 6,412 (up from 6,224), Wigan 6,518 (up from 6,289), Tameside 4,805 (up from 4,654), Rochdale 5,580 (up from 5,432), Stockport 4,691 (up from 4,573), Bury 4,366 (up from 4,253) and Trafford 4,249 (up from 4,120).
There have been two new deaths announced at Salford Royal Hospital, with 258 COVID-19 patients admitted to North West Hospitals on 15th October, compared to 178 the week before; 1,703 COVID-19 patients in the region's hospitals on 17th October, compared to 1,167 the previous week; and 160 patients on mechanical ventilation beds on that date, compared to 133 the previous week.
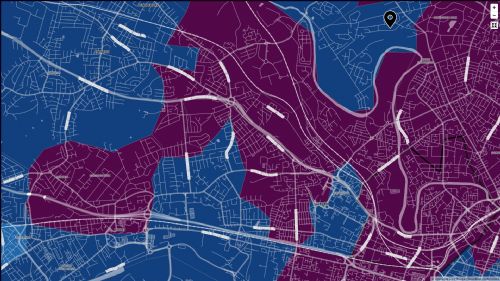
Meanwhile, a new style map of Middle Super Output Areas has been published by the Government showing a lot more detail of virus cases, the seven day rolling rate per 100,000 population, the percentage change since the previous week and the case rate compared to the England average.
In the seven days to 12th October the statistics for Salford areas show 19 districts with percentage rises of cases, nine with percentage reductions and two no change. The full list for all areas reads...
Salford Central and University – 94 cases (rolling rate 621/change down 24.2%)
Higher Broughton – 83 (528.9/up 102.4%)
Broughton Park - 73 (998.8/up 73.8%)
Ordsall and Salford Quays – 63 (406.7/up 12.5%)
Lower Irlam and Cadishead – 53 (508/up 71%)
Eccles – 51 (444.8/up 142.9%)
Ellenbrook and Boothstown – 39 (376.1/up 56%)
Walkden South – 38 (400.5/up 8.6%)
Swinton Worsley Road – 38 (396.6/up 8.6%)
Cromwell Road and Broad Street – 35 (433.7/down 5.4%)
Weaste and Seedley – 34 (256.7/up 47.8%)
Swinton South East and Pendlebury West – 32 (541.2/up 23.1%)
Clifton Green and Pendlebury East – 32 (411.9/no change)
Higher Irlam – 32 (321.8/up 10.3%)
Langworthy Buile Hill – 28 (413.9/down 3.4%)
Worsley – 28 (289.2/down 9.7%)
Walkden North East – 27 (399.3/down 22.9%)
Lightoaks – 26 (466.3/up 73.3%)
Little Hulton South – 26 (364.3/up 85.7%)
Little Hulton North – 25 (298.6/up 38.9%)
Patricroft – 25 (368.1/down 19.4%)
Pendleton – 23 (351.4/down 30.3%)
Kersal Dale – 22 (306.1/down 26.7%)
Barton Upon Irwell – 21 (319.8/up 75%)
Swinton West – 21 (351.9/up 90.9%)
Clifton – 20 (337.4/down 9.1%)
Winton and Westwood – 18 (247.5/up 12.5%)
Walkden North West – 17 (276/no change)
Swinton Newtown – 17 (278.9/up 88.9%)
Peel Green – 9 (147.1/up 12.5%)
To see the map – click here and enter a postcode




.jpg)


.jpg)
.jpg)
(3).jpeg)
.png)
(1).JPG)
